Measuring AI Contributions in Talent Management
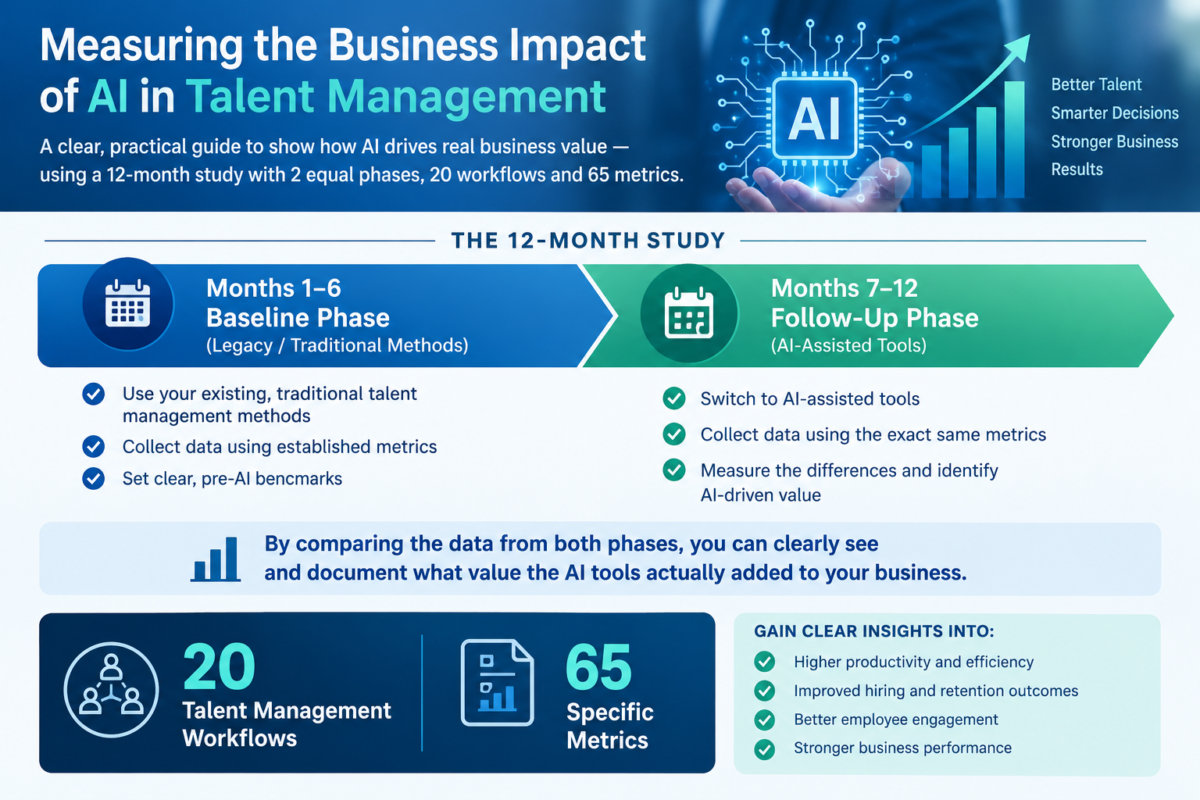
This article introduces a clear guide for measuring the business impacts of AI in talent management. This guide suggests using a 12-month study split into two equal halves.
- Baseline Phase (Months 1–6): The company uses its legacy, traditional talent management methods. Data is collected to set clear, pre-AI benchmarks.
- Follow-Up Phase (Months 7–12): The company switches to AI-assisted tools. Data is collected using the exact same metrics to show the differences.
By comparing the data from both phases, the business can clearly see and document what value the AI tools actually added to the business. This guide is focused on 20 Talent Management Workflows with 65 specific metrics.
HR Workflow | AI Contribution | Agentic AI Contribution | Business Impact |
| Candidate Sourcing (2 metrics) | Identifies and ranks qualified active and passive candidates based on skills, experience, and job requirements. | Autonomously searches talent pools, evaluates candidates, prioritizes prospects, and initiates approved outreach. | Expands the talent pool and pipeline while reducing recruiter workload and time-to-source. |
| Candidate Engagement (3 metrics) | Generates personalized messages and recommends follow-up actions. | Conducts conversational outreach, responds to candidate questions, follows up, and moves qualified candidates through predefined stages. | Improves candidate engagement and accelerates recruiting cycles. |
| Interview Scheduling (1 metric) | Recommends interview times and identifies scheduling conflicts. | Coordinates calendars, schedules multi-party interviews, sends confirmations, and manages rescheduling. | Reduces administrative tasks, time burdens, and scheduling delays. |
| Candidate Screening (2 metrics) | Parses resumes, assesses qualifications, and matches skills to job requirements. | Executes screening workflows, applies approved criteria, identifies skill gaps, and routes candidates to the appropriate next step. | Increases screening efficiency and consistency while allowing recruiters to focus on higher-value activities. |
| Background Checks (3 metrics) | Identifies required checks and tracks completion status. | Initiates approved background-check workflows, communicates with candidates and providers, monitors status, and escalates exceptions. | Reduces process delays and administrative tasks and time burdens. |
| Offers & Preboarding (3 metrics) | Generates offer-related information and recommends preboarding activities. | Coordinates approved offer and preboarding steps, collects required information, and triggers downstream workflows. | Creates a smoother transition from candidate to employee. |
| Onboarding (3 metrics) | Recommends onboarding activities based on role and employee profile. | Orchestrates onboarding end to end—including training, system access, introductions, mentors, documentation, and check-ins. | Helps new employees become productive faster and creates a more personalized experience. |
| Learning & Development (3 metrics) | Recommends courses, certifications, and development opportunities. | Enrolls employees in approved learning paths, tracks completion, schedules follow-ups, and adjusts recommendations based on progress. | Accelerates skill development and supports continuous learning. |
| Skills Management (2 metrics) | Identifies employee skills and highlights competency gaps. | Updates skills profiles based on validated employee activity, learning, projects, and assessments while maintaining defined controls. | Creates a current workforce skills inventory and improves workforce planning. |
| Skills Gap Analysis (2 metrics) | Compares current employee skills and competencies with required future skills and competencies. | Analyzes organizational skill gaps and initiates approved learning, projects, mentoring, or recruiting workflows to address them. | Supports proactive workforce planning and reduces future skill shortages. |
| Internal Mobility (2 metrics) | Recommends internal jobs, projects, andcareer opportunities. | Matches employees to internal career opportunities. Recommends development actions, facilitates applications, and coordinates next steps. | Improves talent retention, career growth, and utilization of existing talent. |
| Performance Management (4 metrics) | Analyzes performance data and recommends goals, feedback, and development actions. | Coordinates check-ins, reminders, goal updates, feedback cycles, and development activities within defined policies. | Creates a continuous and structured performance-management process. |
| Employee Check-Ins (2 metrics) | Analyzes employee feedback and identifies trends or concerns. | Initiates scheduled check-ins, gathers feedback, summarizes themes, and routes appropriate issues to managers or HR. | Helps managers stay engaged with employees while reducing administrative tasks and time. |
| Workforce Planning (6 metrics) | Analyzes workforce data and forecasts talent needs. | Continuously monitors workforce requirements and can initiate approved recruiting, upskilling, reskilling, or internal mobility actions. | Enables organizations to respond proactively to changing workforce demands. |
| HR Service Delivery (5 metrics) | Answers employee questions and retrieves relevant HR information. | Handles multi-step employee requests, gathers required information, executes approved transactions, and escalates exceptions. | Provides faster HR support while reducing repetitive administrative tasks and time. |
| Compliance & Credentialing (4 metrics) | Monitors requirements, deadlines, and missing documentation. | Tracks credentials, sends reminders, initiates renewal workflows, and escalates compliance exceptions. | Reduces compliance risk and administrative workload. |
| Employee Offboarding (5 metrics) | Provides checklists and identifies required offboarding activities. | Coordinates approved access termination, equipment recovery, documentation, knowledge transfer, and exit processes. | Creates consistent offboarding while reducing missed tasks and lowers risks. |
| HR Analytics & Decision Support (5 metrics) | Surfaces trends, insights, predictions, and recommendations. | Monitors defined metrics, investigates workflow exceptions, generates insights, and initiates approved corrective actions. | Moves HR analytics from passive reporting toward action planning. |
| Manager Support (6 metrics) | Provides managers with recommendations, insights, and workforce information. | Acts as a digital HR partner that helps managers execute approved hiring, development, performance, and workforce-management activities. | Gives managers more capacity to focus on leadership and employee relationships. |
| Strategic HR (2 metrics) | Identifies patterns and recommends strategic actions. | Connects multiple HR processes and executes coordinated workflows within organizational guardrails. | Positions HR as a more proactive, data-driven strategic business partner. |
Sixty-five Metrics for measuring AI Contributions to Talent Management.
Candidate Sourcing
Source of Hire – The percentage of total hires that come from specific channels, such as LinkedIn, employee referrals, or job boards (e.g. Indeed).
Sourced-to-Interview Conversion Rate – The percentage of sourced candidates who successfully move past the initial screening into the interview stage.
Candidate Engagement
Candidate Response Rate – The percentage of potential job candidates who reply to a recruiter’s initial outreach message.
Application Completion Rate – The percentage of potential job candidates who reply to a recruiter’s initial outreach message.
Interview No-Show Rate – The percentage of candidates who schedule an interview and then No Show for the interview)
Interview Scheduling
Scheduling Time Saved – The number of hours saved every week by eliminating manual back-and-forth emails, phone calls, and spreadsheet tracking.
Candidate Screening
Screening Pass Through Rate – The percentage of applicants who move past the initial resume or application review to the next hiring stage. How well a hiring team filters job applicants and selects qualified people for interviews.
Time in Screening Stage – The average number of days an application stays in the screening phase before a recruiter accepts or rejects the candidate.
Background Checks
Turnaround Time – The processing time from when a candidate gives consent to when the screening vendor returns the final report.
Cost per Check – The total expense of a single background check.
Adverse Action Rate – The percentage of candidates who are denied employment or lose a job offer based on negative background check results.
Offers & Preboarding
Offer Acceptance Rate – The percentage of extended job offers that candidates formally accept.
Offer Decline Rate – The percentage of candidates who turn down your offer. Tracking reasons for rejection helps refine future proposals. (e.g., compensation, benefits, counter-offers.
Time to Offer Acceptance – The average duration from the moment an offer is sent to when the candidate signs it.
Onboarding
Time-to-Productivity – The average number of days or months it takes a new hire to reach expected performance levels with minimal oversight.
New-Hire Retention Rate – The percentage of new employees who stay past critical milestones, such as the 90-day probation mark or their first 12 to 24 months.
Training Completion Rate – The percentage of required compliance, safety, and role-specific training modules completed on schedule.
Learning & Development
Course Completion Rate – The percentage of learners who finish a training course.
Enrollment Rate – The percentage of target employees who sign up or register for a course.
Learning Hours Completed – The total time in hours that employees invest in learning activities.
Skills Management
Skills Acquisition Progress – The rate at which employees gain new competencies or skills, complete training milestones, or earn professional certifications. If 80 out of 100 employees finish their compliance training, your completion rate is 80%.)
Skill Gap Closure Rate – The percentage of reduction in critical skill shortages across departments over a specific period. If 80 out of 100 skill gaps were closed in one year, the skill gap closure rate is 80%.
Skills Gap Analysis
Development Velocity – Measures how quickly employees acquire, certify, and apply target skills after an intervention is launched.
Remediation Cost Efficiency – Compares the cost-to-train versus the cost-to-hire for critical capabilities to ensure the analysis drives cost-effective workforce planning.
Internal Mobility
Internal Mobility Rate – The percentage of employees who change roles within the company over a set period. Calculate this by dividing the number of internal moves by the average headcount, then multiplying by 100.
Internal Fill Rate – The percentage of open, non-entry-level positions filled by current employees.)
Performance Management
Goal Achievement Rate – The percentage of individual, team, or company goals met during a specific review cycle.
Employee Engagement Scores – Measures morale, motivation, and connection to the company through regular pulse or annual surveys.
Quality and Error Rates – Evaluates work accuracy, defect frequencies, or the amount of rework required.
High-Performer Retention Rate – The percentage of top talent stays with the organization, which often reflects the fairness and clarity of the performance review system.
Employee Check-Ins
Completion Rate – The percentage of employees and managers that complete their required check-in logs or agendas within a specific reporting period.
Action Item Completion Rate – The percentage of commitments or next steps made during a check-in that get finished before the next meeting. This shows whether the conversations lead to real results.
Workforce Planning
Workforce Cost vs. Plan – Compares your actual labor spending against your projected budget to check financial accuracy.
Cost per Hire – Tracks the total advertising, agency, and internal recruitment costs divided by the number of new hires.
Revenue per Employee – Divides total revenue by your headcount to see how efficiently your workforce generates profit.
Internal Fill Rate – The percentage of open roles filled by current employees rather than external hires.
Time-to-Fill – Counts how many days pass from opening a job requisition to candidate offer acceptance.
Vacancy Rate – Tracks key unfilled positions that impact business continuity or revenue.
HR Service Delivery
HR First Contact Resolution – The percentage of employee inquiries or requests resolved during the very first interaction.
HR Ticket Resolution Time – The average duration required to completely close an HR support case. Fast resolution times prevent drops in overall workforce productivity.
HR Support Satisfaction– Measurements of how satisfied workers are with the HR support experience.
HR Self-Service Utilization – The overall volume of traffic and problem-solving attempts managed through employee self-service portals.
HR Escalation Rate -The frequency with which basic inquiries must be passed up to specialized or secondary HR teams.
Compliance & Credentialing
Turnaround Time – The average number of days it takes to fully credential a new provider or staff member from application to approval.
Verification Error Rate – The percentage of applications or files containing missing, incorrect, or unverified background checks, licenses, or board certifications.
Policy Acknowledgement Rate – The percentage of employees who sign and complete mandatory annual compliance training and policy reviews on time.
Incident / Disciplinary Reports – The number of compliance breaches or safety violations reported per quarter.
Employee Offboarding
Access Revocation Time – Tracks how fast IT disables system access and software logins after an employee leaves. A target goal is often within 24 hours or less to prevent security risks.
Asset Recovery Rate – Measures the percentage of company property—such as laptops, security badges, and phones—successfully returned.
Final Pay and Benefits Accuracy – Tracks error-free final paychecks and benefit adjustments processed on time.
Offboarding Cycle Time – Counts the total days from the initial resignation notice to the final working day and administrative closure.
Exit Interview / Survey Completion Rate – The percentage of departing staff who complete exit feedback forms or interviews. Low rates can indicate a negative or rushed exit experience.
HR Analytics & Decision Support
Prediction Accuracy – Compares forecasted trends like predicted turnover or hiring selection accuracy against actual outcomes. High accuracy proves the analytics model works.
Cost Savings or ROI – Calculates the financial return generated by data-driven decisions, such as reduced cost per hire or lower turnover expenses.
Employee Turnover Rate – The percentage of staff who leave the company, used to see if retention models improve over time.
Time to Productivity – How fast a new hire reaches full contribution, reflecting the success of data-backed onboarding.
Employee Engagement and Satisfaction – Gauges employee satisfaction and willingness to recommend the company as a workplace.
Manager Support
One-on-One Meeting Frequency – Track how often managers hold private meetings with direct reports. Effective teams aim for an 85% or higher weekly completion rate.
Response Latency – Measures how fast a manager replies to messages. A good benchmark is responding to urgent issues in under two hours.
Direct Report Feedback Quality – Uses pulse surveys or scorecards to evaluate if feedback is clear, actionable, and helpful for growth.
Retention and Turnover Rates – Monitors voluntary resignations within a specific manager’s team. High turnover often points to poor management support or low morale.
Goal Achievement Rate – Tracks the percentage of team goals completed on time. This shows if the manager successfully guides and clears roadblocks for their team.
Strategic HR
Revenue per Employee – Total revenue divided by total employee headcount, showing overall workforce efficiency.
Training ROI – The financial return gained from professional development compared to the cost spent on training.
Goal Achievement Rate – The percentage of company or departmental goals successfully completed by teams, linking individual output to strategy.
High Performer Turnover Rate – The percentage of high-performing employees who choose to leave the organization.
Employee Engagement and Satisfaction – Gauges employee satisfaction and willingness to recommend the company as a workplace.
Absenteeism Rate – The frequency of unplanned absences, which often signals deeper engagement or wellness issues.
Popular Posts
AI Increases the Efficiency of Your HR Workflows
July 25, 2026
How AI Increases the Utility of Your Talent Pipeline
July 15, 2026
The ROI of AI-Assisted Staffing
May 20, 2026
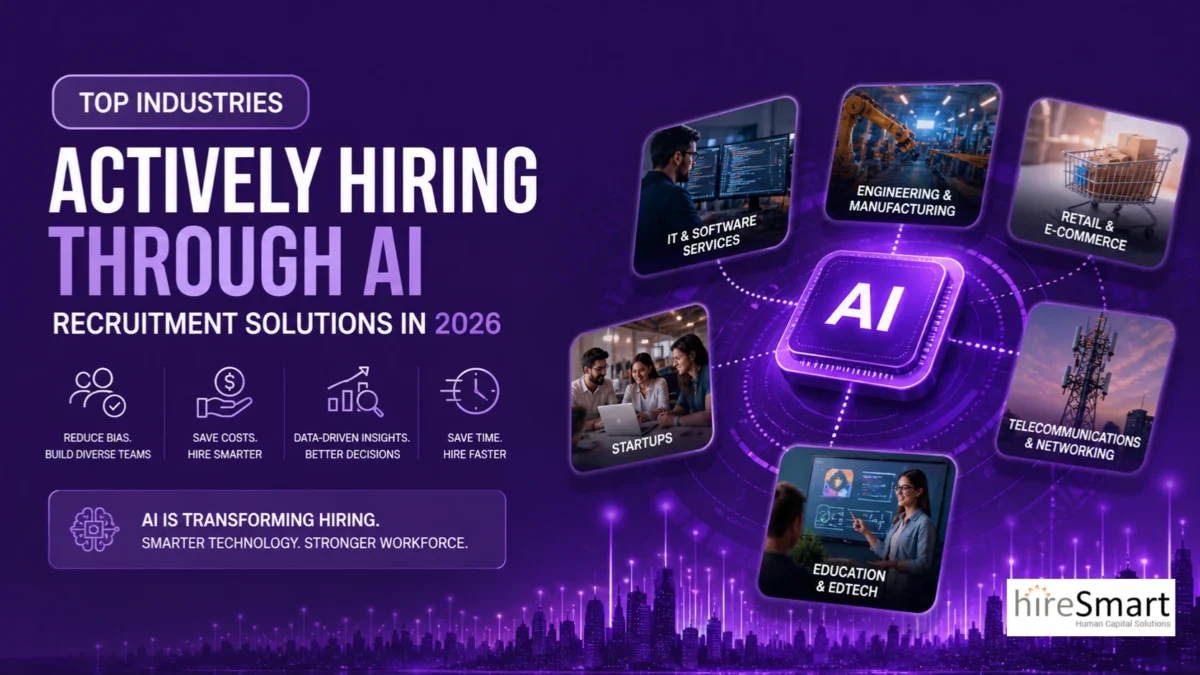

Optimizing Talent Acquisition with AI
March 06, 2025

The History of Artificial Intelligence
January 13, 2025

Crafting the Future Workforce, One Hire at a Time
January 06, 2025
Boost Your Recruitment Strategy with AI-Assisted Staffing
September 24, 2024
Prevue Assessment: The Future of Talent Recruiting and Assessment Solutions
September 23, 2024

Common Qualities of Low Performing Managers
June 23, 2024
Leave a Reply